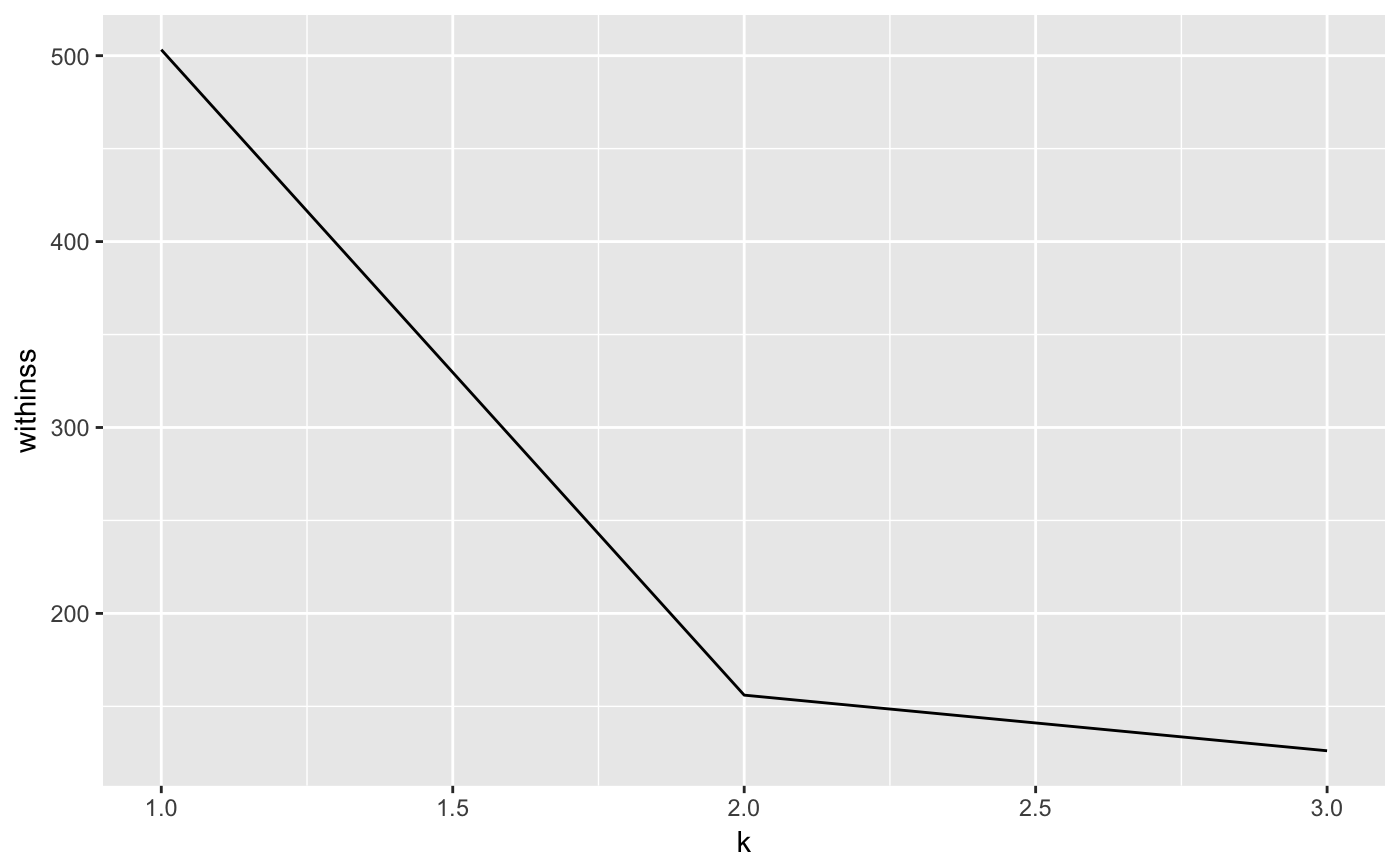
Plot of the sum of the inter-clusters distances (y-axis) for every number of clusters in k (x-axis).
plot_elbow(signatures, k = 1:20, selected = NULL)
Arguments
| signatures | A spectral object built using the load_signature_files function. |
|---|---|
| k | List of values of k to use in the x-axis. |
| selected | The selected value for the report. If provided, it will be printed as a red point in this plot. |
Value
A ggplot2 object.
See also
Examples
data(signatures)
plot_elbow(signatures, k=1:3)