Loading the data
The package includes a small set of signatures called signatures. Load the data
# Loading data
data(signatures)
Spectral class
Let’s see the information of the signatures
print(signatures)## [1] "Spectral signatures of 30 files"summary(signatures)## [1] "Spectral signatures of 30 files\n\n"
##
## Ranges
## Length: 2151
## Min: 350
## Max: 2500
##
## Files
## [1] "signature0000.asd" "signature0001.asd" "signature0002.asd"
## [4] "signature0003.asd" "signature0004.asd" "signature0005.asd"
## [7] "signature0006.asd" "signature0007.asd" "signature0008.asd"
## [10] "signature0009.asd" "signature0010.asd" "signature0011.asd"
## [13] "signature0012.asd" "signature0013.asd" "signature0014.asd"
## [16] "signature0015.asd" "signature0016.asd" "signature0017.asd"
## [19] "signature0018.asd" "signature0019.asd" "signature0020.asd"
## [22] "signature0021.asd" "signature0022.asd" "signature0023.asd"
## [25] "signature0024.asd" "signature0025.asd" "signature0026.asd"
## [28] "signature0027.asd" "signature0028.asd" "signature0029.asd"is.spectral(signatures)## [1] TRUECleaning
We can filter signatures in three different ways: 1. We have used three different sensors for different wavelengths. The change of sensor introduces some error, which can be corrected by smooth_leaps function: just tell the first wavelength of each sensor (but the first one). 2. The lowest wavelengths might include more noise than the rest of the measures. We can filter out the lower wavelengths by using remove_head. 3. The highest wavelengths might include more noise than the rest of the measures. We can filter out the higher wavelengths by using remove_tail.
signatures <- smooth_leaps(signatures, leaps=c(1001, 1831))
signatures <- remove_head(signatures, head=400)
signatures <- remove_tail(signatures,  tail=2400)
Simple plots
We can see the simple plots like signatures and intracorrelation among wavelengths.
plot_signatures(signatures)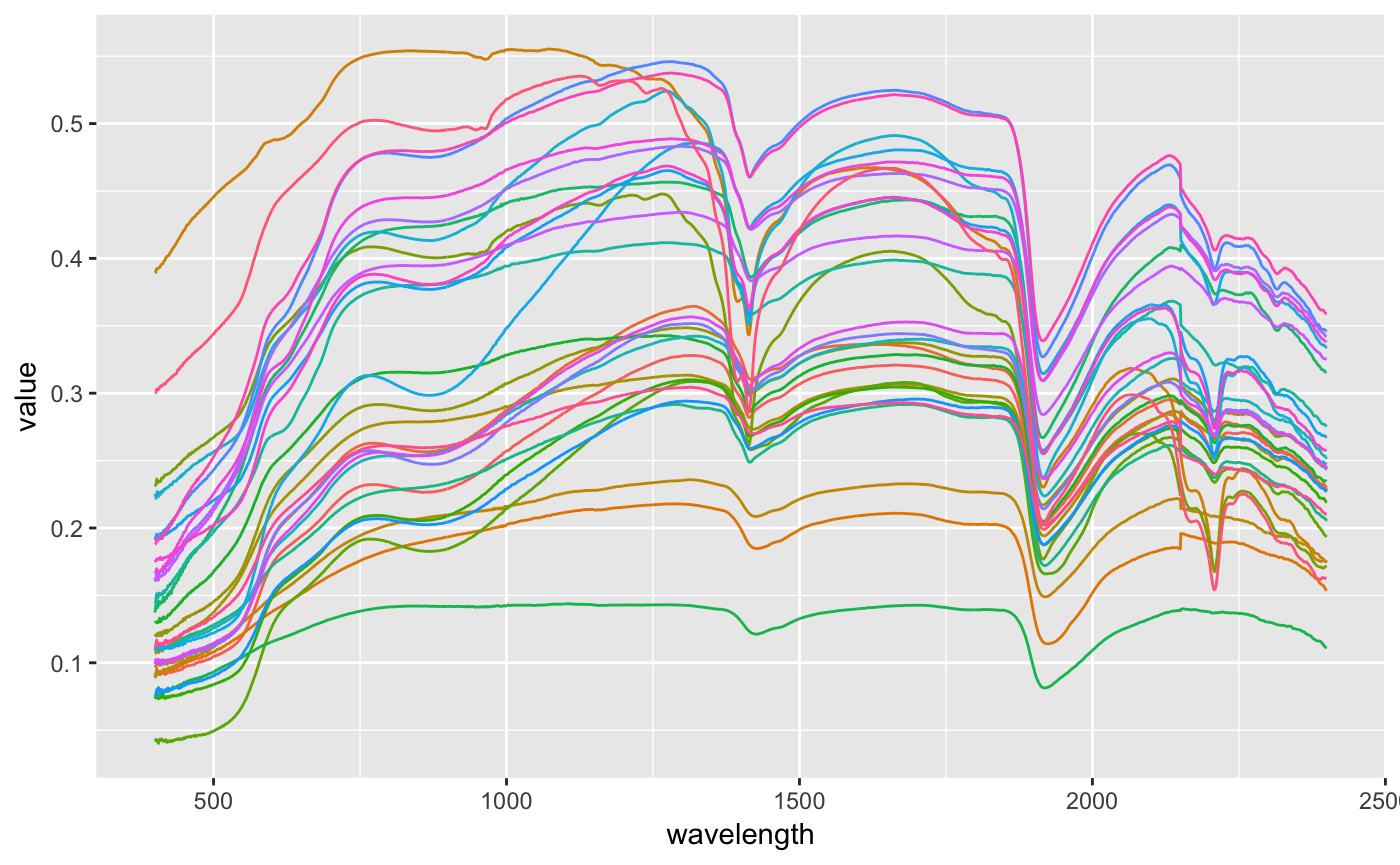
plot_intracorrelation(signatures)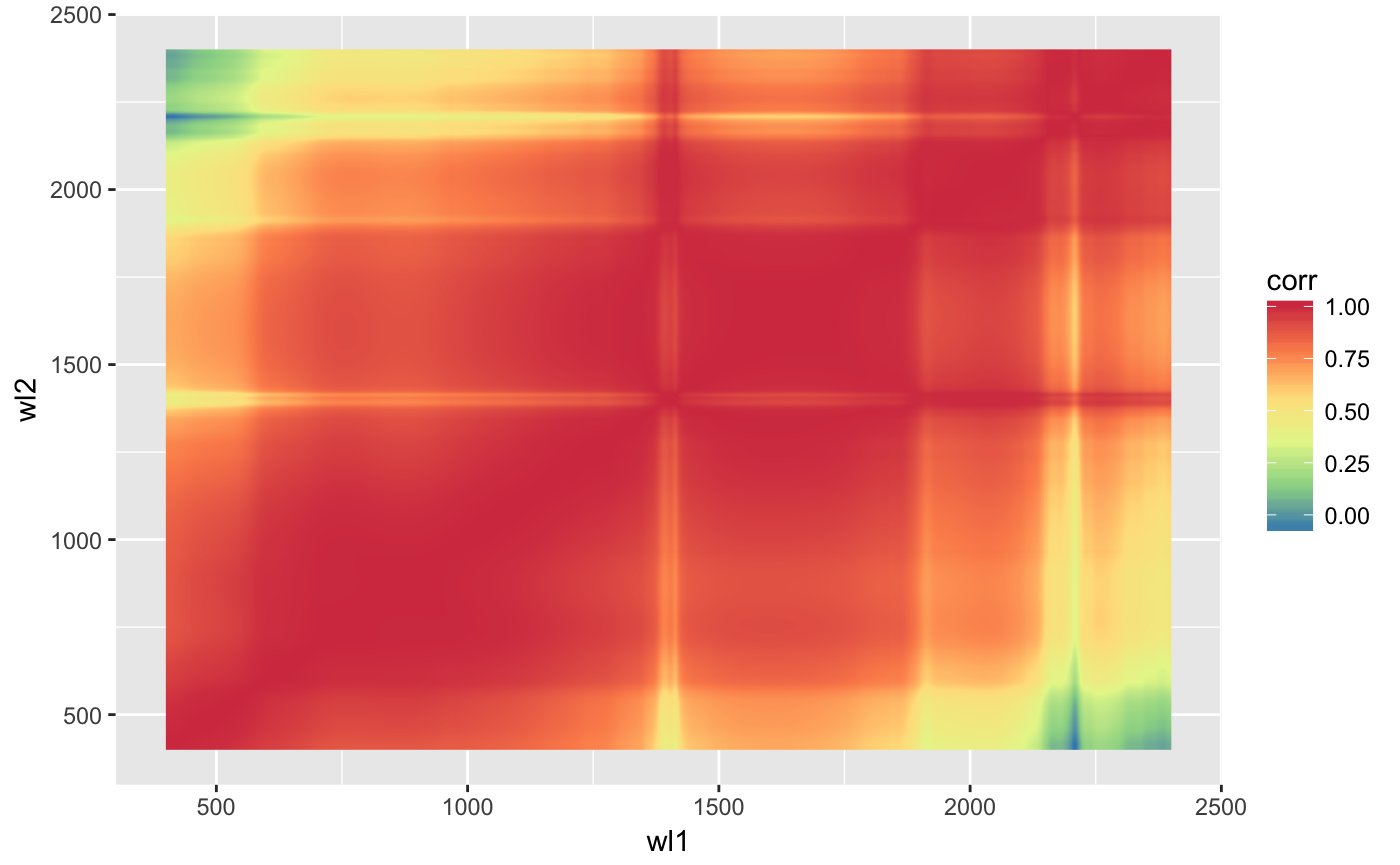
Clustering + endmembers
If we are not sure aboud the possible number of endmembers, we can use the plot_elbow to check the K-Means intercluster error for different number of groups (k). For report purposes, we might want to select a specific value of k in the plot.
plot_elbow(signatures, k=2:4, selected=3)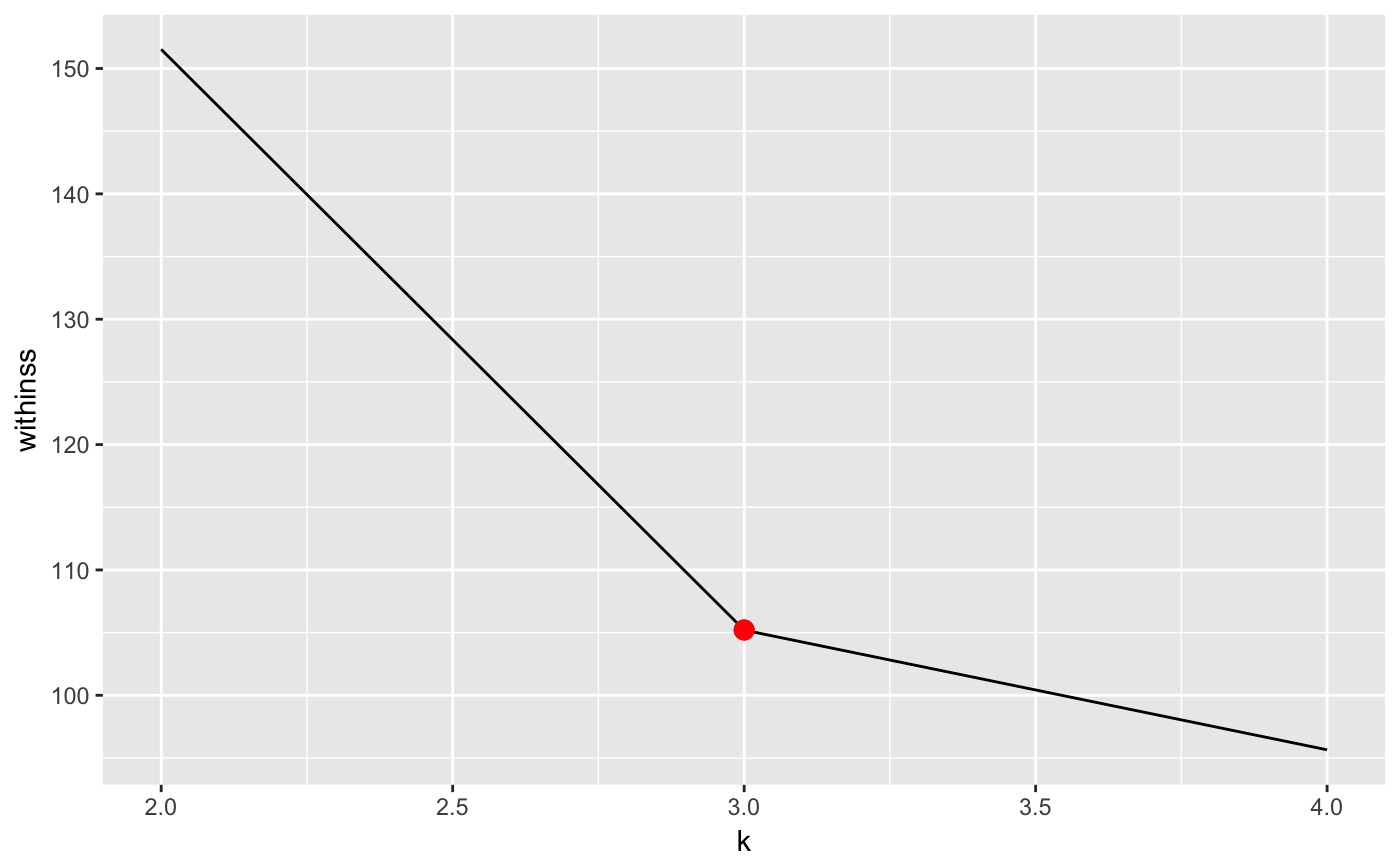
VCA + K-Means
Apply VCA to compute the endmembers using k=2. Then, apply K-Means clustering using a number of clusters k=3.
signatures <- unmixing_vca(signatures, k=2)
signatures <- clustering_kmeans(signatures, k=3)
VCA results in tabular format
See information of VCA in tabular format
table_endmembers(signatures)## endmember file
## [1,] "end1" "signature0003.asd"
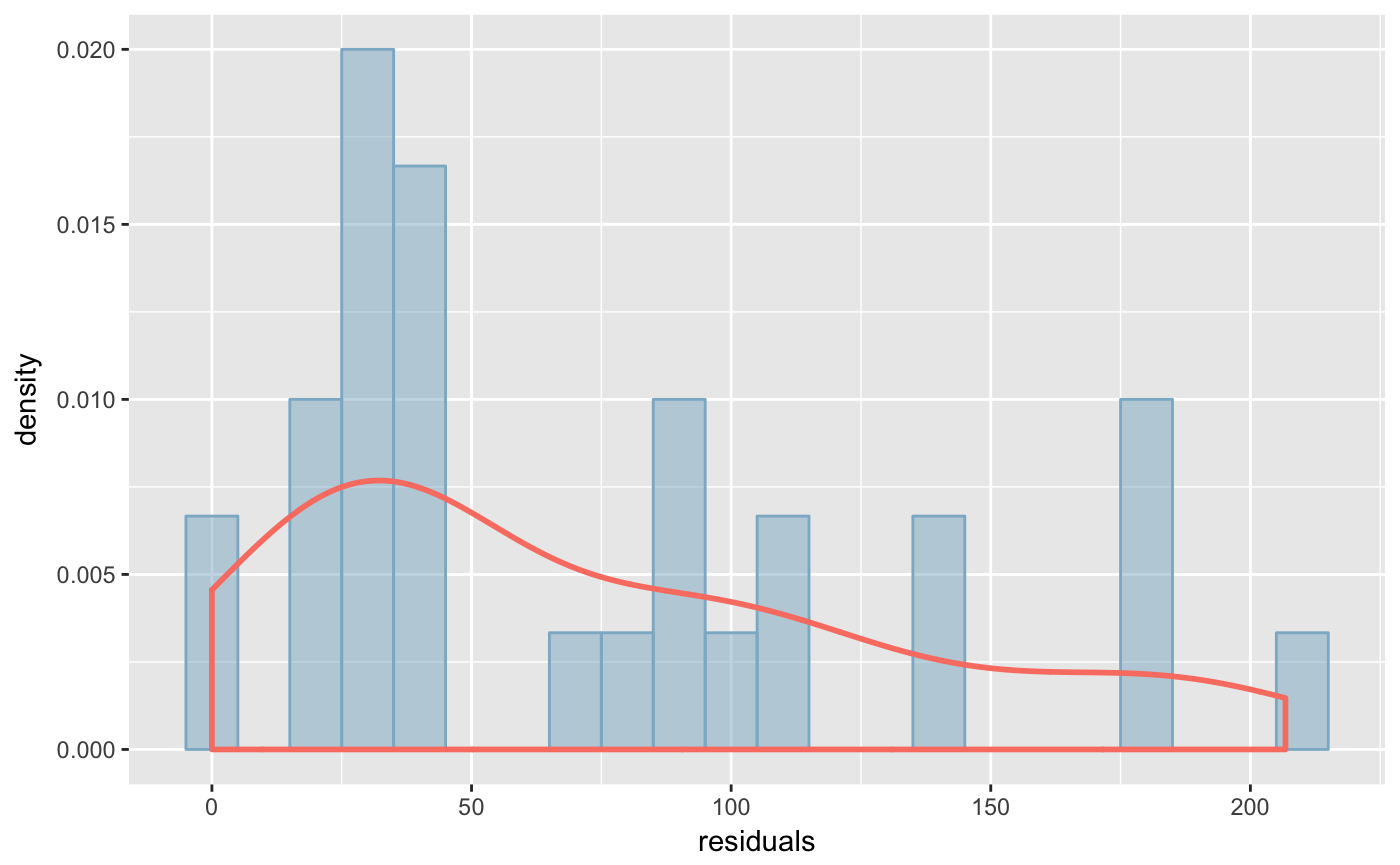
## [2,] "end2" "signature0008.asd"table_residuals_summary(signatures)## Min. 1st Qu. Median Mean 3rd Qu. Max.
## [1,] 0 31.53496 41.47999 73.86042 108.3809 206.7589table_weights(signatures)## file end1 end2 residual
## signature0000.asd signature0000.asd 1.244772e-01 0.8755228 1.794700e+01
## signature0001.asd signature0001.asd 2.033579e-01 0.7966421 2.712874e+01
## signature0002.asd signature0002.asd 0.000000e+00 1.0000000 1.110384e+02
## signature0003.asd signature0003.asd 1.000000e+00 0.0000000 0.000000e+00
## signature0004.asd signature0004.asd 0.000000e+00 1.0000000 8.400181e+01
## signature0005.asd signature0005.asd 1.951355e-01 0.8048645 3.831191e+01
## signature0006.asd signature0006.asd 2.607914e-01 0.7392086 3.121188e+01
## signature0007.asd signature0007.asd 5.827875e-01 0.4172125 2.438262e+01
## signature0008.asd signature0008.asd 5.551115e-17 1.0000000 6.320638e-14
## signature0009.asd signature0009.asd 5.892800e-02 0.9410720 1.614830e+01
## signature0010.asd signature0010.asd 2.996020e-01 0.7003980 3.728891e+01
## signature0011.asd signature0011.asd 0.000000e+00 1.0000000 2.067589e+02
## signature0012.asd signature0012.asd 6.102835e-01 0.3897165 1.125209e+02
## signature0013.asd signature0013.asd 9.392152e-02 0.9060785 3.337845e+01
## signature0014.asd signature0014.asd 4.862400e-01 0.5137600 7.146232e+01
## signature0015.asd signature0015.asd 1.933235e-01 0.8066765 3.727895e+01
## signature0016.asd signature0016.asd 6.979570e-01 0.3020430 1.004084e+02
## signature0017.asd signature0017.asd 4.412113e-01 0.5587887 1.842767e+02
## signature0018.asd signature0018.asd 5.689620e-01 0.4310380 8.953630e+01
## signature0019.asd signature0019.asd 4.265196e-02 0.9573480 2.617232e+01
## signature0020.asd signature0020.asd 8.204294e-01 0.1795706 1.800544e+02
## signature0021.asd signature0021.asd 1.923668e-01 0.8076332 3.250422e+01
## signature0022.asd signature0022.asd 6.683584e-01 0.3316416 1.355704e+02
## signature0023.asd signature0023.asd 5.556483e-01 0.4443517 9.229643e+01
## signature0024.asd signature0024.asd 2.065922e-01 0.7934078 4.464806e+01
## signature0025.asd signature0025.asd 6.943844e-01 0.3056156 1.410226e+02
## signature0026.asd signature0026.asd 5.659348e-01 0.4340652 9.084280e+01
## signature0027.asd signature0027.asd 8.240195e-01 0.1759805 1.772751e+02
## signature0028.asd signature0028.asd 1.580937e-01 0.8419063 3.743232e+01
## signature0029.asd signature0029.asd 8.540686e-01 0.1459314 3.491365e+01VCA and clustering results as plots
See information of VCA and K-Means as plots
plot_endmembers(signatures)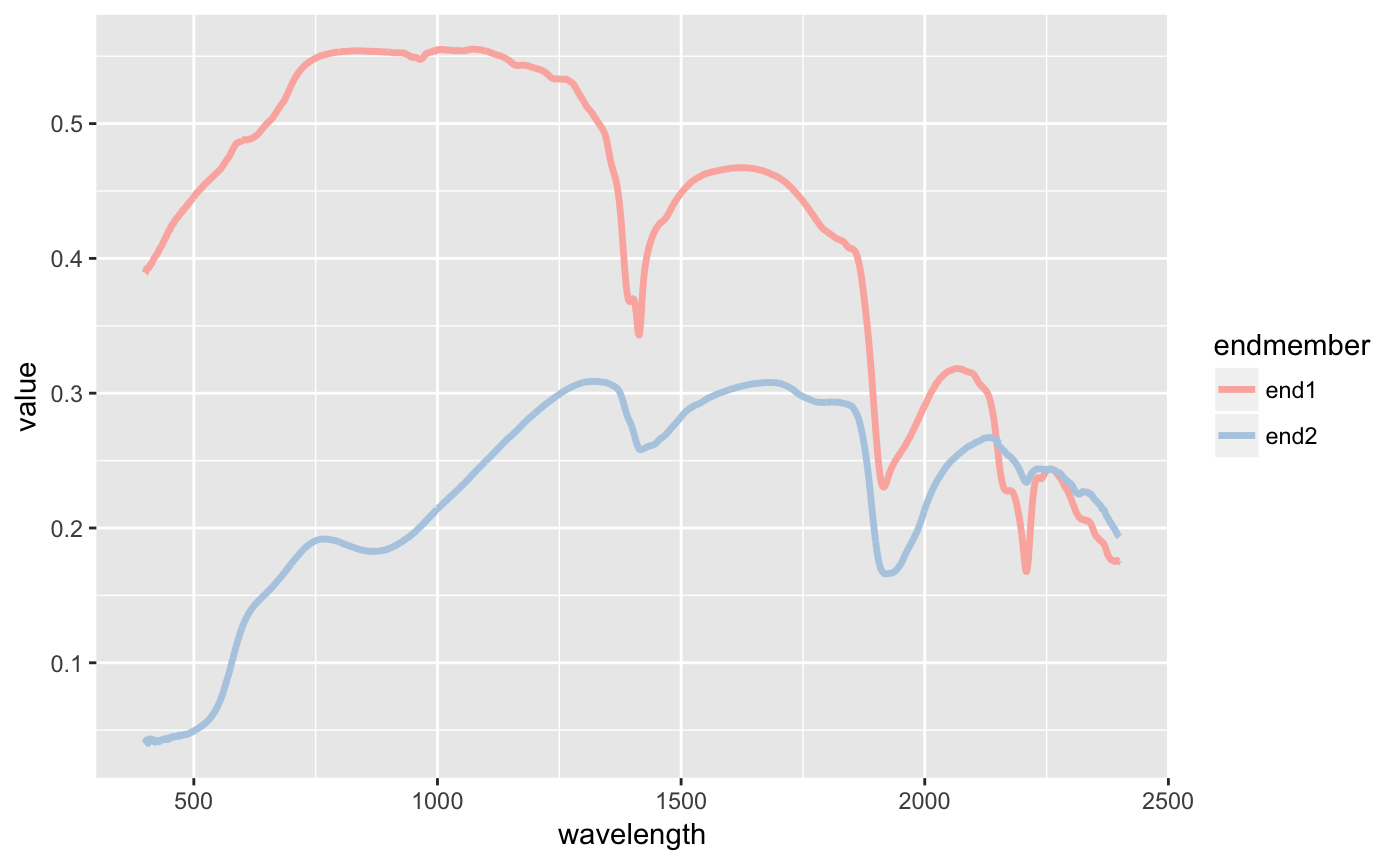
plot_clusters(signatures)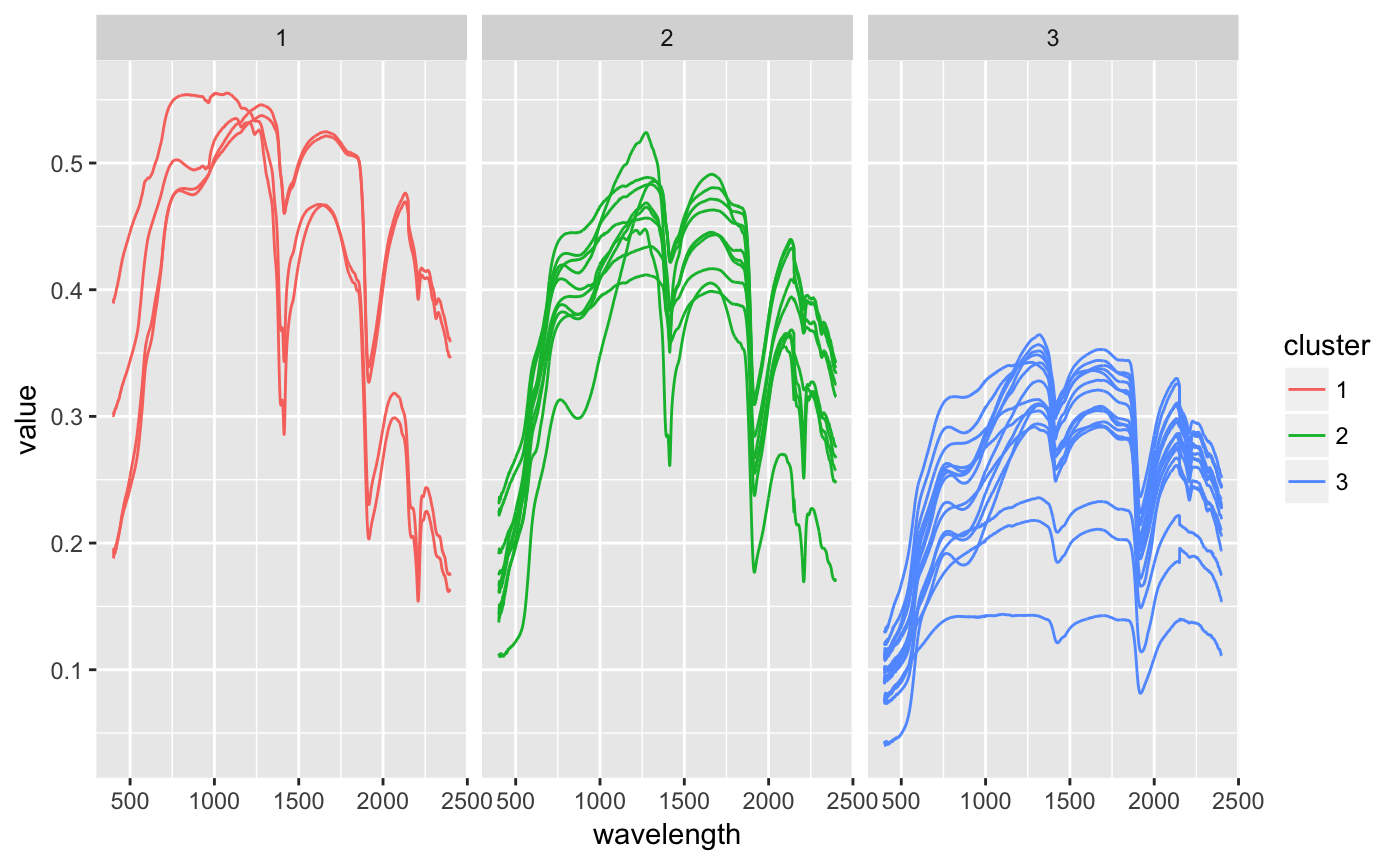
plot_mutualinfo(signatures)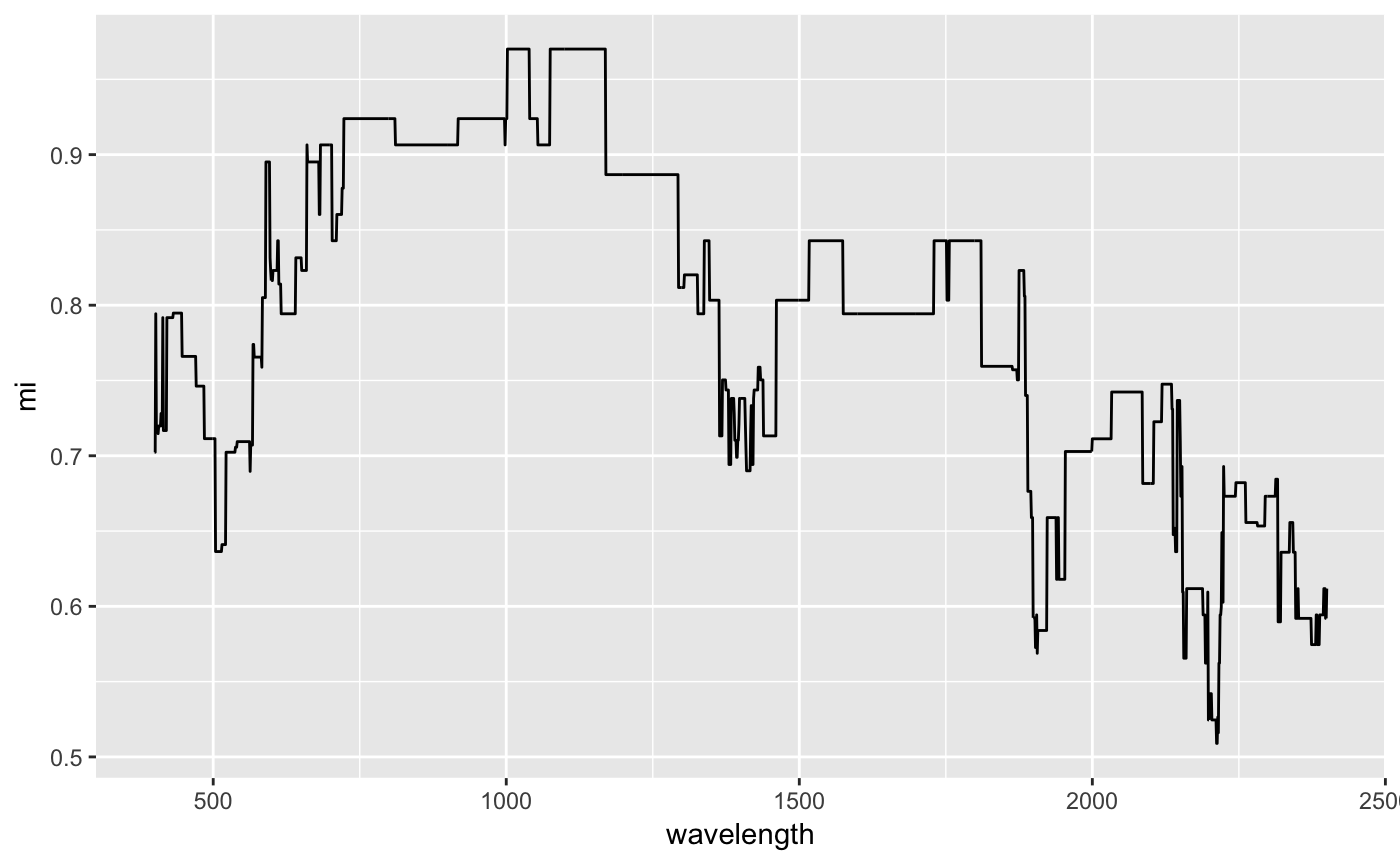
plot_endmember_cluster(signatures)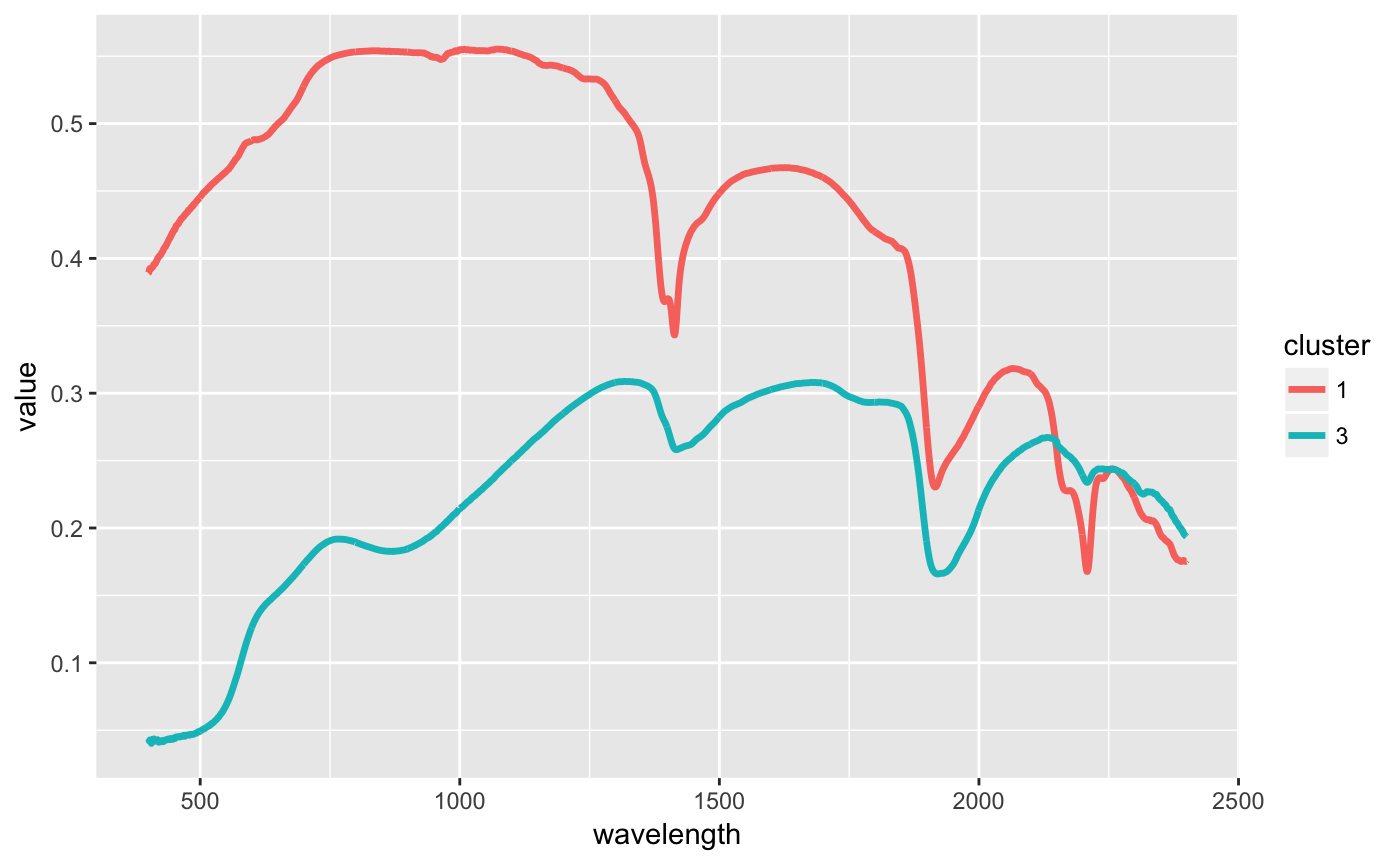
plot_endmember_density_bar(signatures)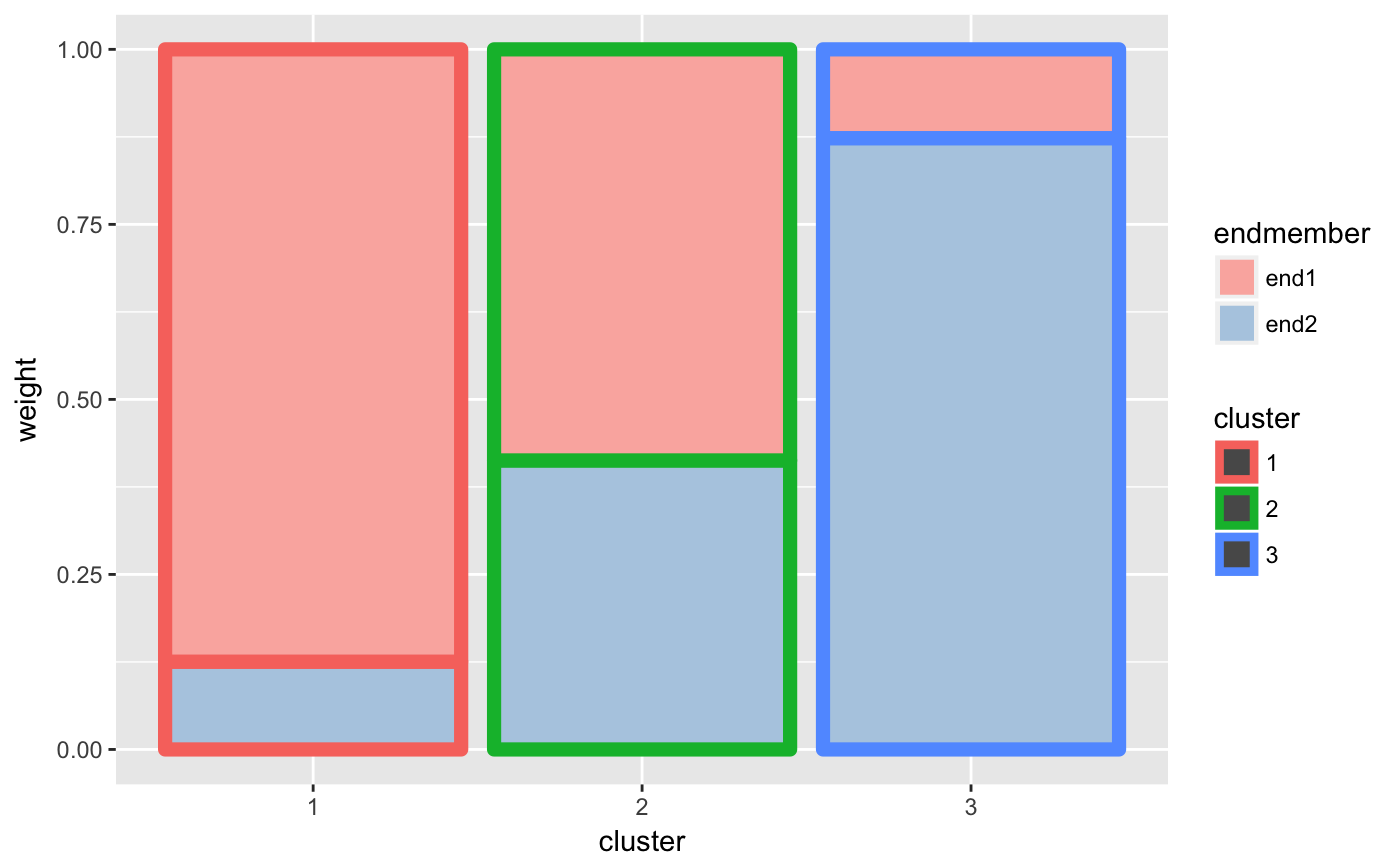
plot_endmember_density_box(signatures)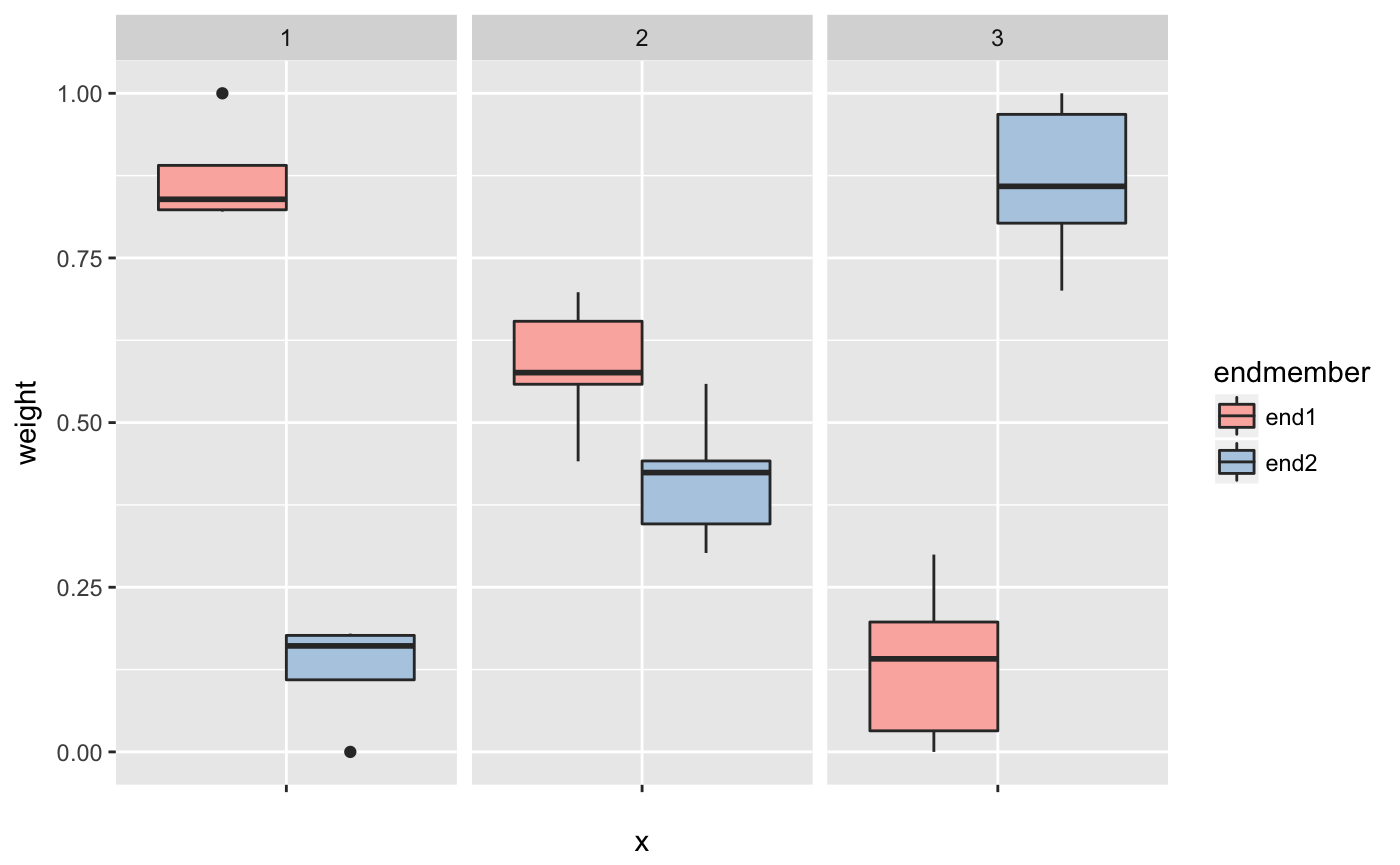
plot_residuals(signatures)